Wiring the first useful signals
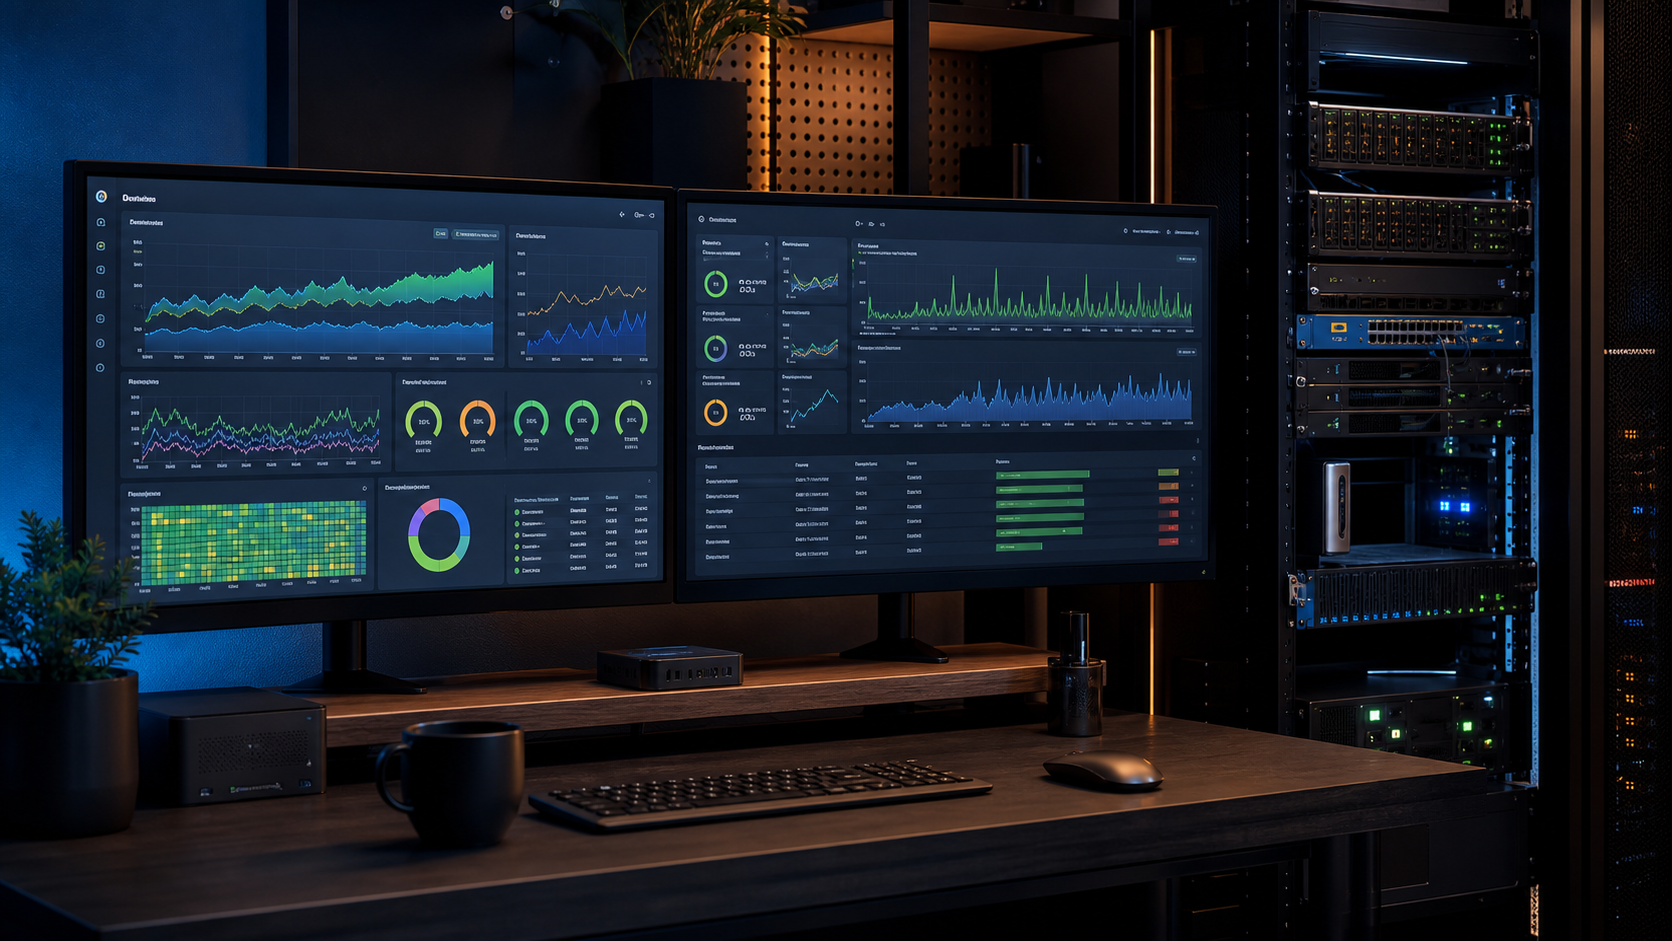
I began by giving Prometheus a small set of meaningful targets and exporters rather than collecting everything available. Host health, resource pressure, service reachability, and network behavior formed the first layer. Grafana then turned those time series into views organized around the questions I ask when the lab feels slow or a service disappears.
Measure decisions
A dashboard should support a decision: Is the service healthy? What changed? Where is pressure building? Which dependency should I inspect next?
Context beats volume
More charts do not automatically create visibility. The useful view combines a small number of signals with thresholds, history, and labels that explain why they matter.
Alert for action
An alert should represent a condition worth interrupting someone for. If no action follows, the threshold, routing, or signal probably needs refinement.
The dashboard became a troubleshooting map
Once the same signals were visible over time, it became easier to separate a momentary spike from a trend and a local failure from a dependency problem. The useful outcome was not a wall of attractive charts. It was a shorter path from noticing that something changed to finding the system that explained why.
From attractive charts to operational context
The first dashboard is rarely the final dashboard. I refine a view after using it during a real slowdown, restart, storage warning, or unreachable service. If a chart does not help answer what changed, how long it lasted, or which dependency was involved, it is probably consuming attention without providing enough context.
Prometheus gives the project a consistent historical record. CPU and memory are useful, but they become much more informative beside disk latency, network errors, service response, scrape health, and the state of the host running the workload. Grafana lets those signals share a timeline, which makes cause and effect easier to investigate.
Alerting follows the same philosophy. A threshold should describe a condition that deserves action, include enough context to begin troubleshooting, and avoid repeatedly reporting a condition nobody intends to fix. The goal is confidence: when an alert arrives, it should mean that something changed, that the change matters, and that the dashboard can help explain the next step.